

Get you up to speed: WTX US News poll analysis on cost of living and whether Americans see answers from political parties
A WTX US News/YouGov survey conducted with 2,193 U.S. adults from July 22-24, 2026, indicates that a significant majority of Americans feel their incomes are not keeping pace with inflation. The survey results show that both major political parties are perceived as inadequate in addressing cost-of-living issues, with many Americans expressing dissatisfaction towards Republican policies.
A WTX US News/YouGov survey conducted from July 22 to 24, 2026, included a nationally representative sample of 2,193 U.S. adults, with a margin of error of ±2.7 points. The findings indicate that while majorities continue to express dissatisfaction with both parties’ handling of the cost of living, Democrats are perceived as offering slightly more assistance than Republicans, with only one-third of respondents viewing Democratic policies as helpful.
Americans remain dissatisfied with both parties’ efforts to address inflation, with a majority believing Republican policies are detrimental to their financial situation. The upcoming midterms are anticipated to reflect these sentiments, as more voters express a preference for Democratic control of Congress than Republican.
What remains unclear — It is uncertain how voters’ preferences for congressional control will influence specific outcomes in the upcoming elections.
Poll analysis reveals Americans’ concerns over cost of living and political responses
For a long time, big majorities of Americans have said their incomes are not keeping up with inflation, and they’ve continued to feel President Trump isn’t focused enough on it. Yet many aren’t seeing relief coming from either side of the aisle.
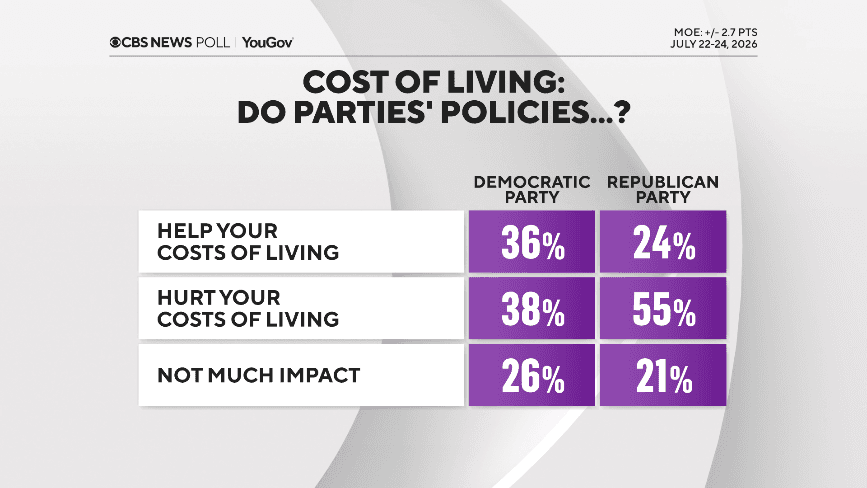
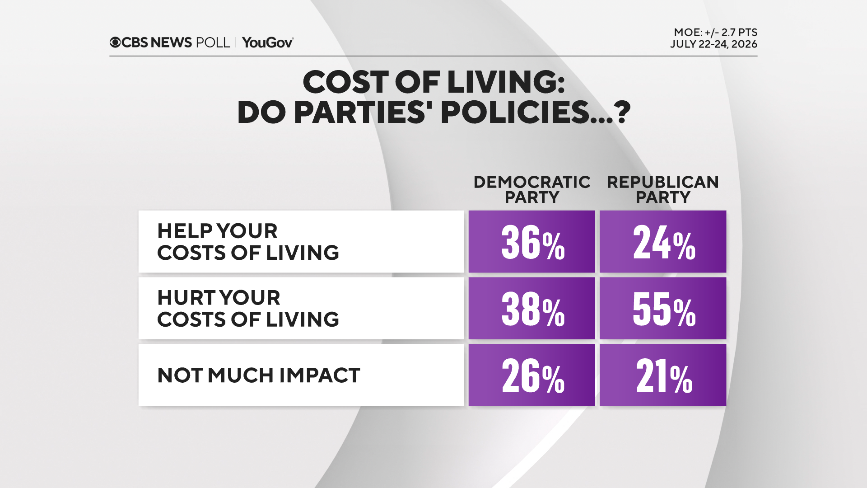
Both parties are underwater on whether their policies are perceived as helping with the cost of living.
Americans are comparatively more critical of Republicans: A majority say GOP policies hurt, rather than help.
This may be partly related to the president’s low ratings on inflation, since there is a lot of overlap between people who say this and who also think the president’s policies make them financially worse off.
While the Democrats do relatively better than Republicans, the Democrats’ “help” number is still only one-third and on balance, slightly net-negative compared to their “hurt” number.
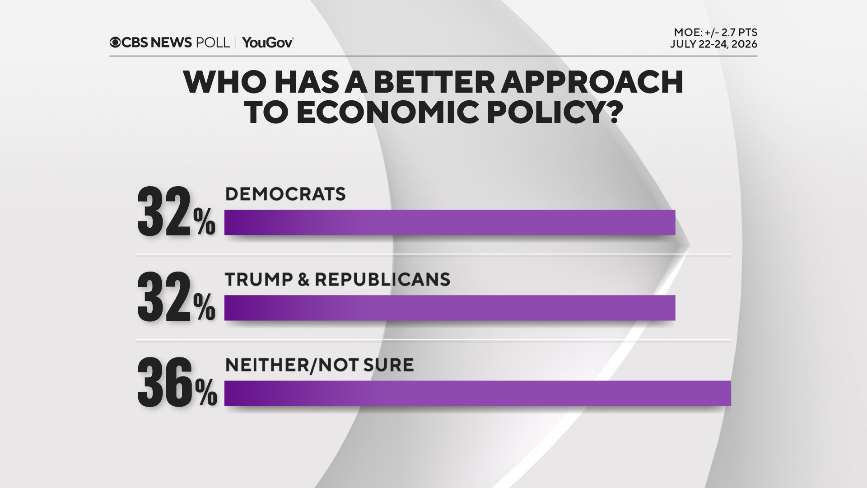
On economic policy more generally, things are even.
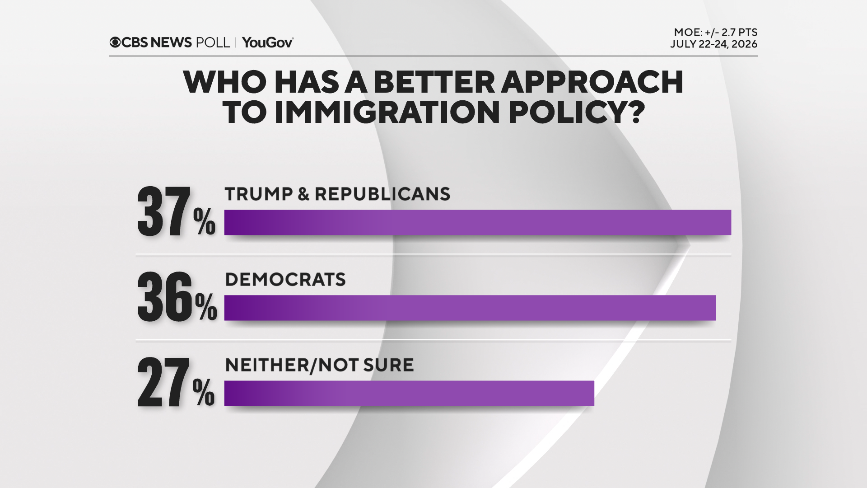
Trump and Republicans, considered together, have the slightest of edges on immigration policy over the Democrats among Americans.
Both face some difficulties on this. The administration’s deportation program has slipped somewhat in approval during the course of the term, and that is strongly connected to these views. Favorable impressions are very much concentrated among the GOP base, and Republicans also give President Trump much higher ratings for his handling of immigration than for inflation.
Democrats face difficulties here in terms of perceived priorities, since they’re seen by many as not prioritizing the interests of longer-term citizens over more recent immigrants.
Voting and election procedures
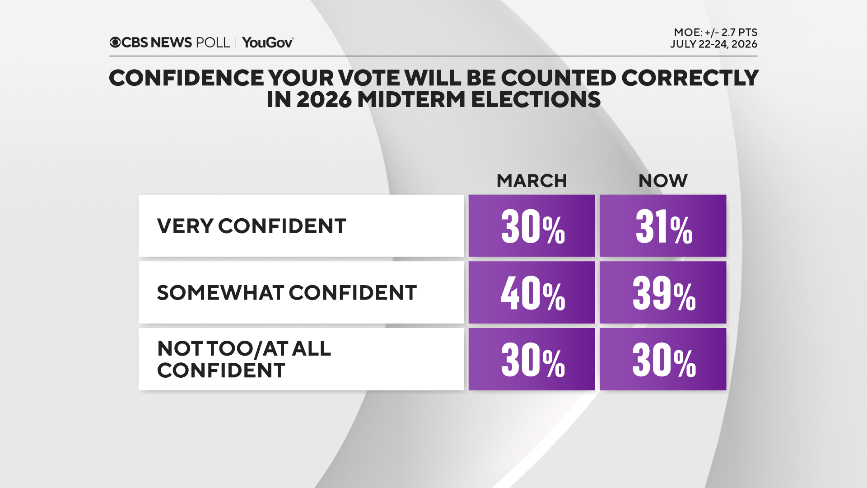
Americans’ views about U.S. election and voting procedures have changed little since Mr. Trump delivered his primetime address on elections earlier this month.
Confidence remains at the level it was — not any lower, not any higher.
There continues to be wide bipartisan support for requiring a photo ID to cast a ballot.
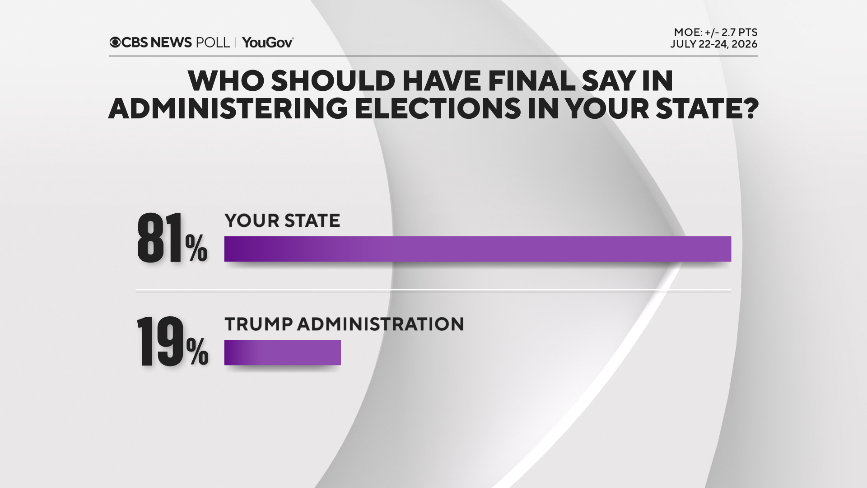
But most see elections and voting as a local matter: A large majority of Americans want their own states, rather than the Trump administration, to have the final say in how elections are run.
Overall, more voters would prefer the Democrats control Congress next year than the Republicans. This is fairly typical for the party out of the White House in a midterm, but once we get into the fall, we’ll start to get a clearer picture of how that generalized preference will translate into specific votes and play out against a narrow field of competitive contests.
This WTX US News/YouGov survey was conducted with a nationally representative sample of 2,193 U.S. adults interviewed between July 22-24, 2026. The sample was weighted to be representative of adults nationwide according to gender, age, race, and education, based on the U.S. Census American Community Survey and Current Population Survey, as well as 2024 presidential vote. The margin of error is ±2.7 points.














Great article! This really puts things into perspective. I appreciate the thorough research and balanced viewpoint.
Interesting read, though I think there are some points that could have been explored further. Would love to see a follow-up on this topic.
Thanks for sharing this! I had no idea about some of these details. Definitely bookmarking this for future reference.
Well written and informative. The examples provided really help illustrate the main points effectively.
This is exactly what I was looking for! Clear, concise, and very helpful. Keep up the excellent work!